The mortgage rate that feels “normal” today is not actually normal. At the same time, the rates many buyers remember from just a few years ago were not normal either.
Buyers looking at mortgage rates in the mid-6% range in 2026 are often comparing them to an extremely unusual four-year period that the housing market may never experience again. Meanwhile, buyers who purchased homes in the early 1980s would look at today’s rates very differently.
To understand where mortgage rates are right now, it helps to zoom out and look at the full history of modern mortgage lending since Freddie Mac began tracking rates in 1971. The story is not a straight line up or down. Mortgage rates have moved through long cycles shaped by inflation, Federal Reserve policy, recessions, global events, and investor behavior.
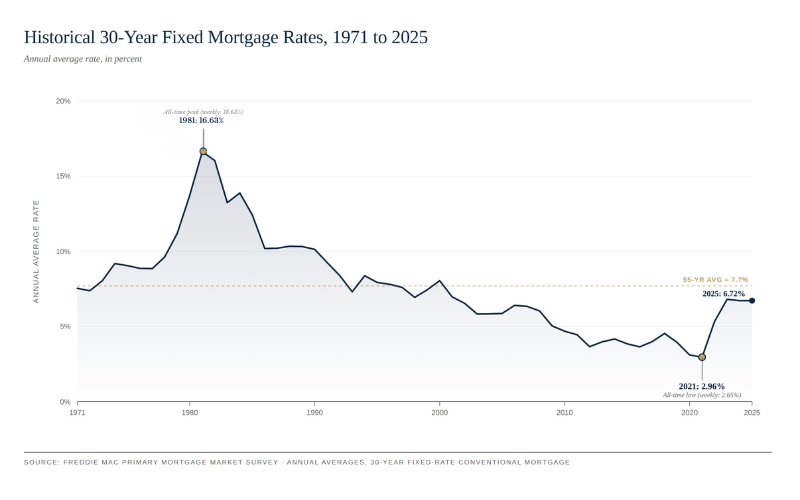
Over the last 50+ years, the average 30-year fixed mortgage rate has been closer to 7.7%. That means today’s market is actually much closer to historical norms than many buyers realize. The true outlier was the pandemic-era market of 2020 and 2021.
Where This Mortgage Rate Data Comes From
The historical mortgage rate data referenced throughout this article comes from the Freddie Mac Primary Mortgage Market Survey, commonly called the PMMS. Freddie Mac has published national average mortgage rate data every week since April 1971, making it the longest continuous mortgage rate dataset available in the United States. When economists, journalists, or housing analysts reference “historical mortgage rates,” this is usually the dataset they are relying on.
The PMMS tracks rates offered to highly qualified borrowers putting 20% down on a conventional 30-year fixed mortgage. Individual buyers may receive different rates based on credit score, loan type, loan size, occupancy, and other factors, but the PMMS remains one of the best indicators of broader mortgage market trends. Fannie Mae and Freddie Mac both publish economic forecasts and housing commentary as well, but the PMMS serves as the benchmark historical record for how mortgage rates have moved over time.
The 1970s: Inflation Changes Everything
When Freddie Mac began tracking rates in 1971, the average 30-year fixed mortgage rate was 7.33%. Through the early part of the decade, rates generally stayed between 7% and 9%, which at the time felt relatively manageable for most buyers. That changed quickly as inflation accelerated throughout the decade.
The 1973 oil embargo sent energy prices soaring and triggered one of the most significant inflationary periods in modern U.S. history. Inflation climbed into double digits and remained elevated for years. Mortgage rates followed because mortgage lending is deeply tied to the broader bond market, especially the 10-year Treasury yield. When inflation rises, investors demand higher returns to offset the declining purchasing power of future payments. As bond yields rise, mortgage rates typically rise alongside them.
By 1979, the average annual mortgage rate had climbed above 11%. For homeowners, the difference between buying early in the decade versus late in the decade was dramatic. A buyer financing a home in 1971 faced a completely different borrowing environment than someone purchasing a similar property eight years later. The rapid rise in rates reshaped affordability and permanently changed how Americans thought about financing a home.
1981: The Highest Mortgage Rates in Modern History
In October 1981, the Freddie Mac survey reached 18.63%, the highest mortgage rate ever recorded for a 30-year fixed mortgage. Even today, that number feels almost impossible to imagine for buyers accustomed to rates in the 5% to 7% range.
A borrower financing an $80,000 mortgage at 18.63% faced monthly principal and interest payments of roughly $1,250. At a 4% rate, that same loan would cost only a fraction of that amount. During the early years of those mortgages, the overwhelming majority of the payment went toward interest rather than principal, which made building equity painfully slow unless homeowners paid aggressively toward the balance.
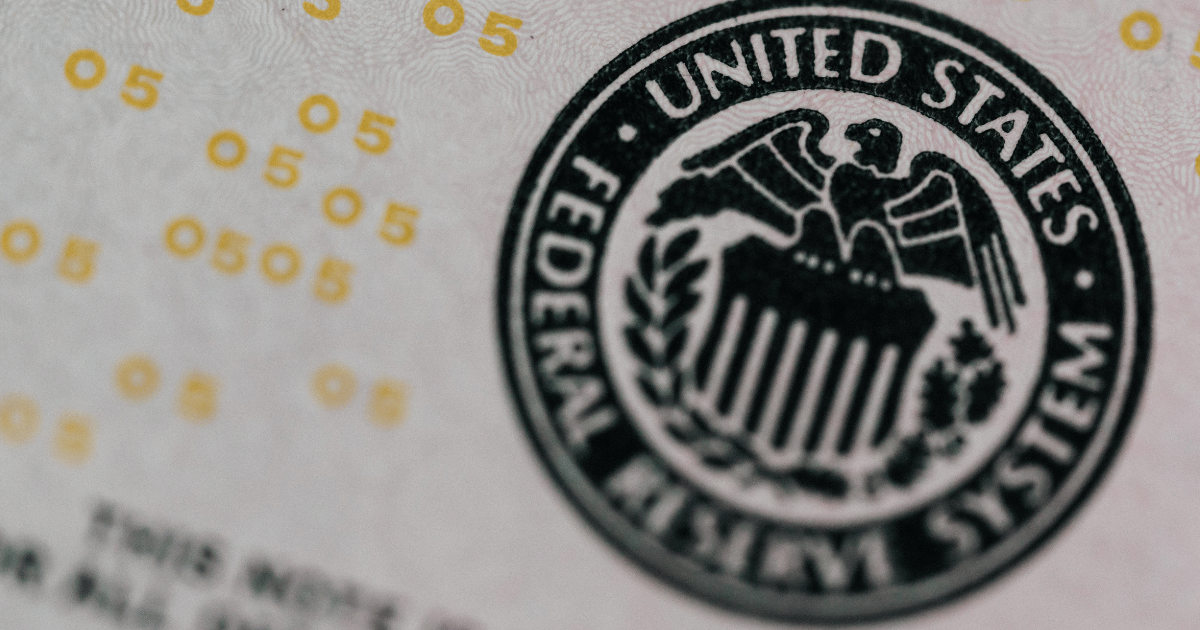
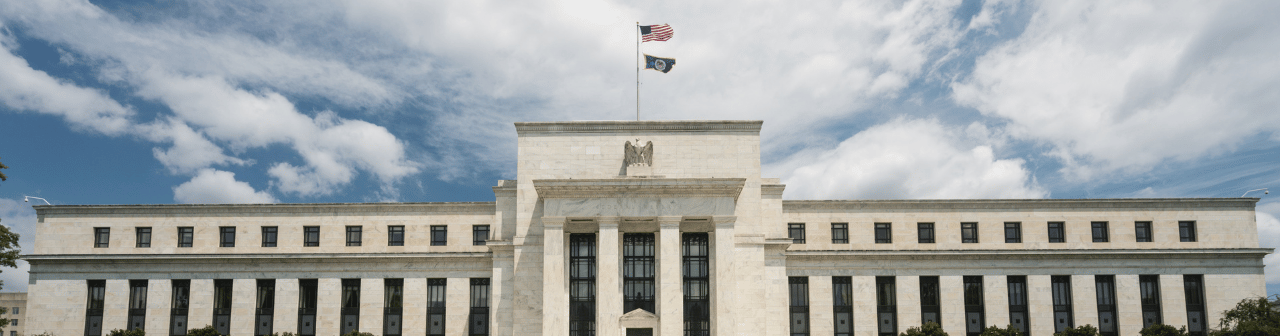
The housing market suffered tremendously during this period. Home sales dropped sharply, builders went bankrupt, and many real estate professionals left the industry entirely. These rates were not simply the result of market conditions spiraling out of control. They were the direct outcome of Federal Reserve policy under Chairman Paul Volcker, who aggressively raised interest rates to combat runaway inflation.
The strategy worked, but it came at a steep cost. Inflation eventually fell significantly, but the early 1980s became one of the most difficult affordability periods in modern housing history. For many buyers, simply qualifying for a mortgage became incredibly difficult.
The 1980s and 1990s: A Long Decline Begins
Once inflation came under control, mortgage rates began a long downward trend that would last for decades. By the mid-1980s, average mortgage rates had fallen into the low teens. By the early 1990s, they were generally sitting in the 8% to 9% range. In 1993, average rates dropped to 7.31%, which was the lowest level seen in more than twenty years.
For buyers during this period, rates in the 7% range felt like a major improvement compared to what previous generations had experienced. Several factors helped drive this long-term decline. Inflation stabilized, the Federal Reserve remained focused on controlling inflation expectations, globalization reduced costs, and productivity improvements supported stronger economic growth. Bond investors no longer demanded the massive inflation premiums that had defined the 1970s.
This era also reinforced a lesson that still matters today. Buyers rarely keep the same mortgage rate forever. Homeowners refinanced repeatedly as rates declined throughout the 1980s and 1990s. The mortgage rate at the time of purchase was often only the starting point, not the rate borrowers carried for the full life of the loan.
That idea remains incredibly important in today’s market, especially for buyers worried about whether current rates are “too high” to move forward.
The 2000s: Cheap Money and the Housing Bubble
Mortgage rates continued drifting lower through the early 2000s. By 2003, the average annual 30-year fixed rate had fallen to 5.83%, helping fuel one of the biggest housing booms in American history. Cheap borrowing costs alone did not cause the housing bubble, but they certainly contributed to it alongside loose underwriting standards, speculative buying activity, and risky lending products.
When the housing market and broader financial system began unraveling in 2008, the Federal Reserve responded aggressively. Short-term interest rates were slashed, and the Fed launched large-scale purchases of mortgage-backed securities to stabilize the housing market and financial system.
Mortgage rates fell quickly as a result. By 2012, the average annual mortgage rate had dropped to 3.66%, the lowest annual average recorded at that point in Freddie Mac’s historical dataset. This period fundamentally reshaped expectations for many buyers entering the market. A generation of homeowners came to believe that rates in the 3% to 4% range were normal, even though historically they were anything but.
If you want to better understand how inflation, Treasury yields, and Federal Reserve policy all influence mortgage rates, CapCenter’s educational resources break down how those relationships work and why rates move the way they do.
2020 and 2021: The Lowest Mortgage Rates Ever Recorded
When the pandemic hit in 2020, the Federal Reserve moved even more aggressively than it had during the financial crisis. Short-term rates were cut to nearly zero almost immediately, and massive bond-buying programs flooded financial markets with liquidity. The Fed also purchased enormous quantities of mortgage-backed securities specifically to help suppress mortgage rates and stabilize housing activity during the uncertainty surrounding the pandemic.
The result was unprecedented. In January 2021, the Freddie Mac survey hit 2.65%, the lowest mortgage rate ever recorded in the history of the PMMS. The average rate for all of 2021 was just 2.96%, making it the cheapest mortgage money modern buyers had ever seen.
For homeowners who purchased or refinanced during this period, the savings were enormous. A borrower financing $400,000 at 2.75% secured a monthly principal and interest payment dramatically lower than what that same loan would cost at today’s rates. That difference continues to shape today’s housing market in a major way.
Many homeowners who locked in ultra-low rates during 2020 and 2021 are reluctant to sell because replacing those mortgages would significantly increase their monthly payments. This phenomenon, commonly referred to as the “lock-in effect,” has constrained inventory across much of the country and contributed to continued upward pressure on home prices.
At CapCenter, this environment has also changed how many buyers think about financing strategy. More buyers are considering future refinancing flexibility, adjustable-rate mortgages, or temporary buydowns as part of the broader affordability equation instead of focusing solely on the initial rate.
2022 Through 2024: The Fastest Mortgage Rate Reset in Decades
By 2022, inflation had surged to levels not seen in forty years. The Federal Reserve responded with one of the fastest rate hiking cycles in modern history, pushing the federal funds rate from near zero to above 5% in a relatively short period of time.
Mortgage rates reacted quickly. Average rates jumped from below 3% in 2021 to above 5% in 2022, then climbed into the high-6% and 7% range by 2023. In October 2023, Freddie Mac’s weekly survey peaked at 7.79%, which represented the highest mortgage rates seen in over two decades.
The affordability shock was severe. Monthly payments increased dramatically for buyers entering the market, while refinance volume collapsed almost overnight because very few homeowners could improve on the rates they had already secured during the pandemic years.
Still, there is an important piece of context many people miss. Even mortgage rates approaching 8% were not historically extreme. They felt extreme because the market had become anchored to the unusually low rates of the prior decade. Historically speaking, rates in the 6% to 8% range are much closer to long-term averages than rates in the 2% to 3% range ever were.
2025 and 2026: A Return Toward Historical Norms
As inflation cooled during 2025 and into 2026, the Federal Reserve began gradually cutting short-term interest rates again. Mortgage rates moved somewhat lower as well, though not nearly as quickly as many buyers hoped they would.
That disconnect often confuses buyers because the Federal Reserve does not directly control mortgage rates. Mortgage rates tend to follow the 10-year Treasury yield, which reflects investor expectations surrounding inflation, economic growth, and future Federal Reserve policy. Sometimes mortgage rates move ahead of Fed cuts, and sometimes they barely move at all.
In 2026, mortgage rates sitting in the mid-to-low 6% range are not especially cheap, but they are also not historically high. They sit relatively close to the long-term average for modern mortgage history. For many buyers, this has forced a major mindset shift. The question is no longer whether rates will fall back to 3%. The more practical question is whether the home purchase works financially today and whether the borrower has the flexibility to refinance later if rates improve.
That distinction matters far more than many buyers initially realize.
What Mortgage Rate History Actually Teaches Buyers
One of the biggest lessons from fifty years of mortgage rate history is that buyers rarely keep the same mortgage forever. Homeowners refinance. Buyers who purchased homes in the early 1980s eventually refinanced into dramatically lower rates. Buyers who purchased in the 2000s refinanced multiple times during the 2010s. Even homeowners who bought in 2023 or 2024 may eventually refinance if rates continue easing.
That is one reason CapCenter’s ZERO Closing Cost mortgage structure becomes especially valuable over time. Traditional refinances often come with thousands of dollars in closing costs, which can make borrowers hesitate even when a refinance would lower their monthly payment. Many homeowners spend years trying to “break even” on refinance costs before they see meaningful savings.
CapCenter eliminates that traditional calculation. With ZERO Closing Costs on eligible purchase loans, refinances, and home equity loans, homeowners can respond more freely when market conditions improve. If rates fall and refinancing makes financial sense, clients are not forced to weigh whether paying thousands upfront is worth the savings.
Over the life of a mortgage, that flexibility can become a meaningful financial advantage. Mortgage rates move in cycles, and borrowers who can adapt to those cycles without repeatedly paying closing costs are often positioned far better long term.
The second major lesson is that trying to perfectly time mortgage rates rarely works. Rates react constantly to inflation reports, labor market data, Federal Reserve commentary, geopolitical events, and investor sentiment. Buyers waiting for rates to fall slightly may discover home prices or competition rise at the same time. In many cases, the better decision is focusing on affordability, long-term goals, and finding the right property rather than trying to predict short-term market movements.
At CapCenter, a phrase often used internally captures this idea well: marry the home, date the rate. The home is the long-term decision. The mortgage rate can change later.
What Buyers and Homeowners Should Watch Going Forward
For buyers tracking mortgage rates in 2026 and beyond, a few indicators matter more than daily headlines.
The first is the 10-year Treasury yield, which remains one of the strongest leading indicators for where mortgage rates are headed. The second is inflation data, since mortgage rates generally improve when inflation continues cooling and worsen when inflation begins reaccelerating. The third is Federal Reserve policy guidance. While the Fed does not directly set mortgage rates, its broader policy direction heavily influences the bond market.
It is also important not to overreact to daily market swings. Mortgage rates can move noticeably from one day to the next, but the broader six-to-twelve-month trend is usually what matters most for refinancing opportunities and long-term affordability decisions.
That is one reason CapCenter publishes mortgage rates openly every day without requiring an application first. Buyers and homeowners should be able to monitor the market, compare options, and understand what payments actually look like without immediately entering a sales funnel.
The Bottom Line
The history of mortgage rates since 1971 is ultimately a story of cycles. Rates rose sharply during inflationary periods, declined during periods of economic stability, reached historic highs in the early 1980s, and eventually fell to historic lows during the pandemic years.
The rates buyers see today are much closer to long-term historical norms than the unusually cheap money that defined 2020 and 2021. For buyers and homeowners, the most important takeaway is not trying to predict the perfect rate environment. It is understanding how flexibility shapes long-term savings.
Mortgage rates will continue moving up and down over time. Buyers who position themselves to refinance efficiently when opportunities appear often come out ahead over the full life of a loan. That is one of the biggest advantages of CapCenter’s approach to mortgage lending. With ZERO Closing Costs available on eligible purchase loans, refinances, and home equity loans, clients are positioned to adapt as the market changes instead of being locked into costly refinance decisions later.
If you want to explore what today’s rates look like for your situation, CapCenter’s mortgage calculator lets you run real numbers and compare payment scenarios without submitting an application first.